Summary Brand
![]()
![]()
![]()

|
Summary Brand
|
|
Data Analysis 122 Amazon
|
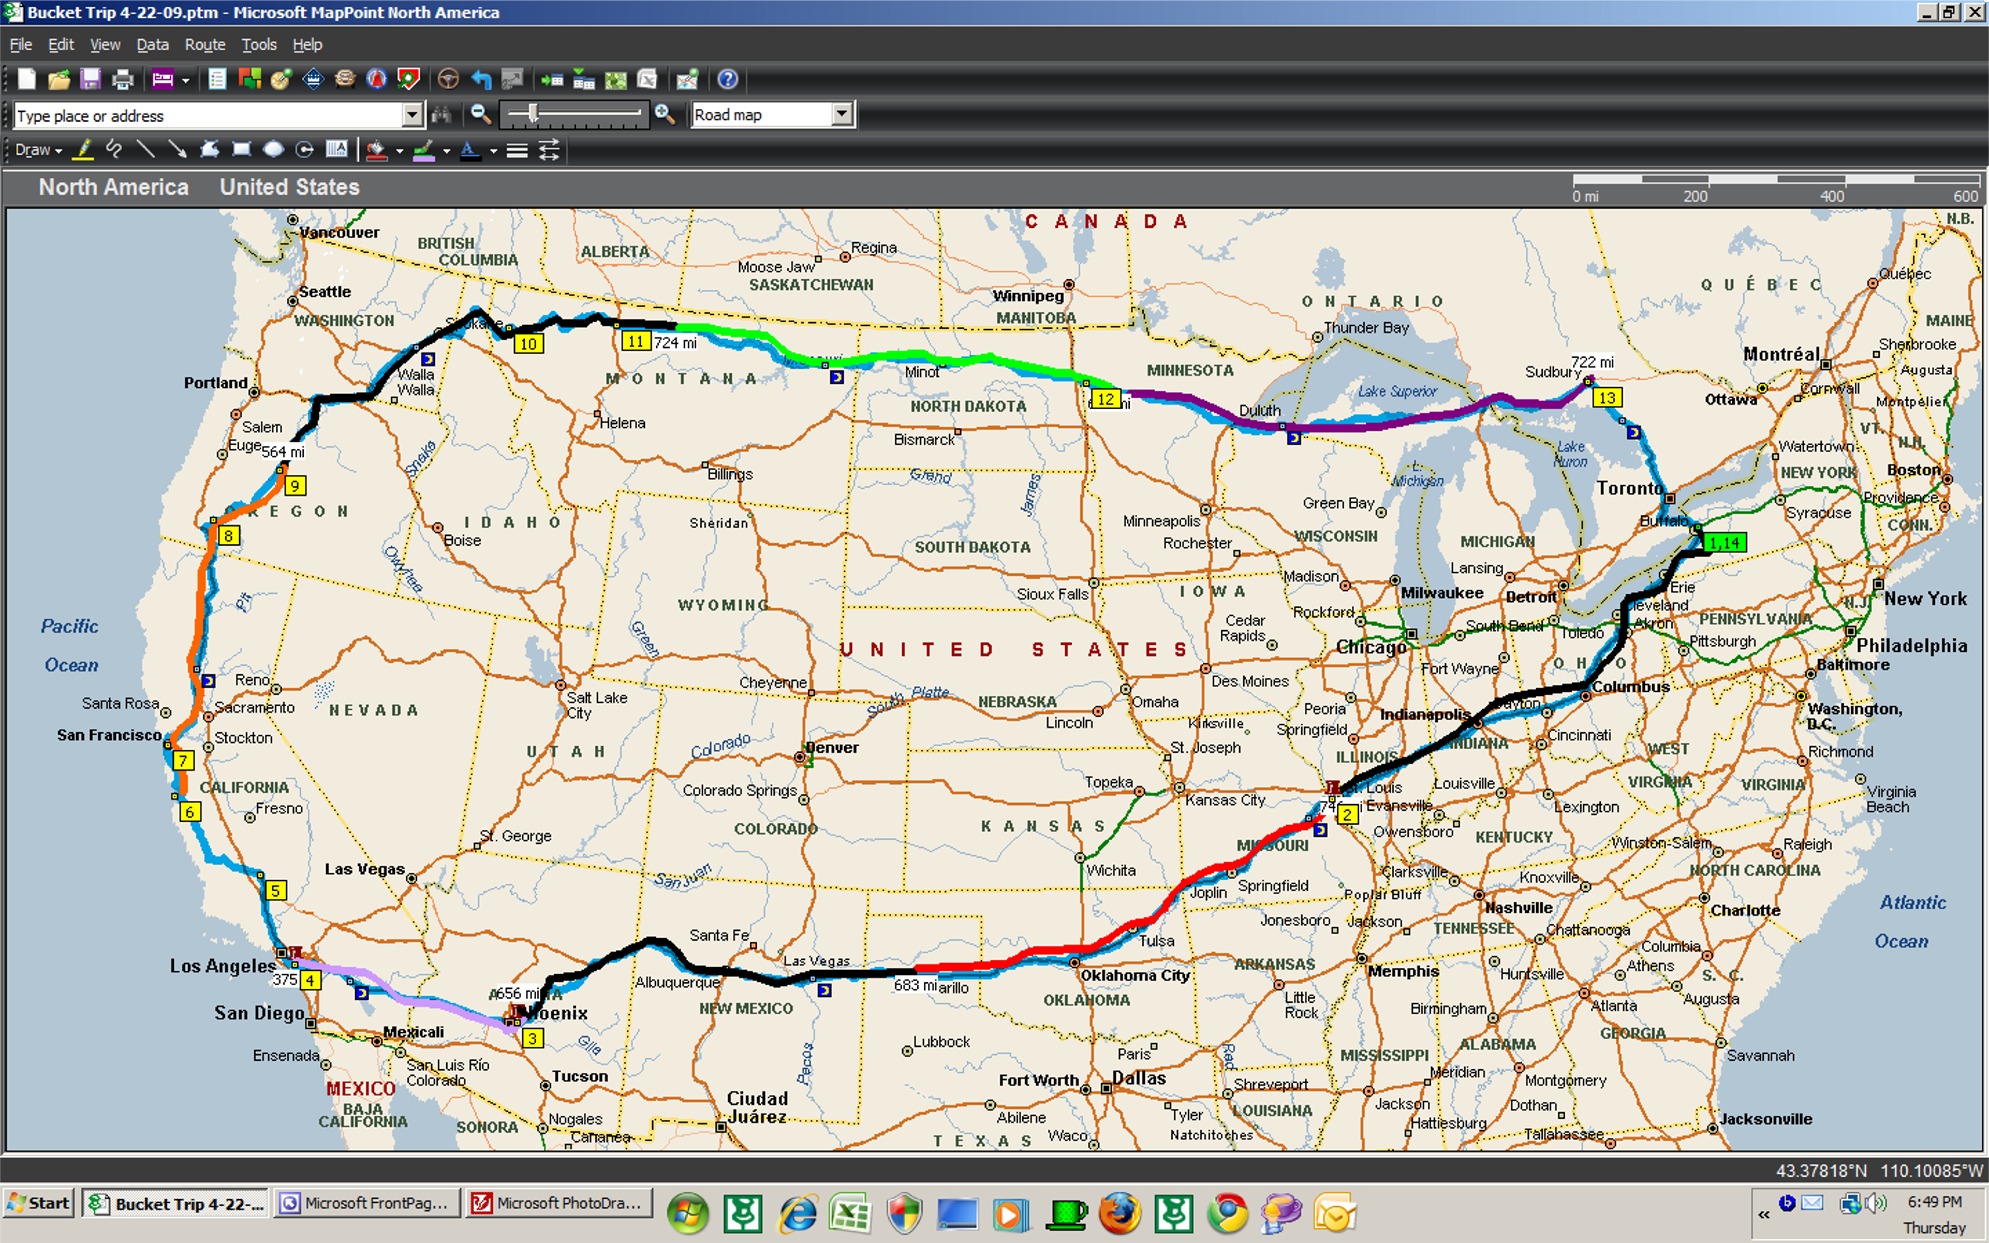
We have been challenged to create a dataset of bicycle dealers that will include the specific Brands that each shop offers to the public. At issue is compiling information from different sources into a single comprehensive database that includes valid and accurate information with a margin if error of less than 10%. One of the problems is the dynamic changes from shifting zip codes and area codes to moving down the street, across town or opening a new store. Obviously this is a moving target but we have diligently sifted through different resources to arrive at a comprehensive database. With the infinite options of the internet there are many places to acquire this information. We begin with the "Dealer Locator" of the brand and to gather as much information as is available. Many times the "locator" offers incomplete information so we also go to individual web sites for the retail dealer. Here we can find further insights as to the different brands offered from this location. Once the names, address and specific brand is established, we then add demographic data including separating the dealers into Markets (MSA) and associating the dealers into groups by sales territories. Below is the database displayed on a MapPoint map showing the outline of a "market"
Below is a map of the Minneapolis area with the icons revealed. When you double click on the "Bike Shop" icon it opens a call out that will show information about that specific location. In this example I have the brands offered and then listed in alphabetical order. Please also notice the Red and Blue outlines that show the drive times from a central Minneapolis location. The red line is 20 Minutes while the blue line shows a 10 minute drive time. As you can see, this takes into consideration that a highway will take you further in the same amount of time.
Below is a map of the area with the above Icons showing the brands in each shop. I have listed only these 4 brands and only in the "Data Only" mode of display. As you can see, this visualizes brand separation and concentration. With MapPoint 2004, you can zoom in and click to reveal all data. Any data can be included in the "Call Out" Including Phone Number, contact name or even sales dollars if available and calculations when Last Year compared to This year results in a percent (%) gain or loss.
Below is the same map with a call out that tells selected demographic statistics about the market. This one shows that Minneapolis St.Paul has a population of 3,043,061 persons and 1,169,340 households, A household income average of $71,294 with a population of 994,789 in the 25-44 age group, and there are 352,240 households with a combined income of greater than $100,000. Additional calculations result in a 32.6% ratio in the target age and 30.1% of the households with the target income level of over $100K.....This information can be further broken down in the same manner to the ZIP Code level thereby illustrating best locations and
Below is the same map but it now contains the census data at the Zip Code Level where I colored the individual zip codes in Yellow for lower income households, Tan illustrates $50K to $75K income levels, Orange is $75k - 100K with Red being Over $100K average income levels.
Call Christopher at 716-631-0592 or Email Christopher@Georger.com
Thanks!
|